

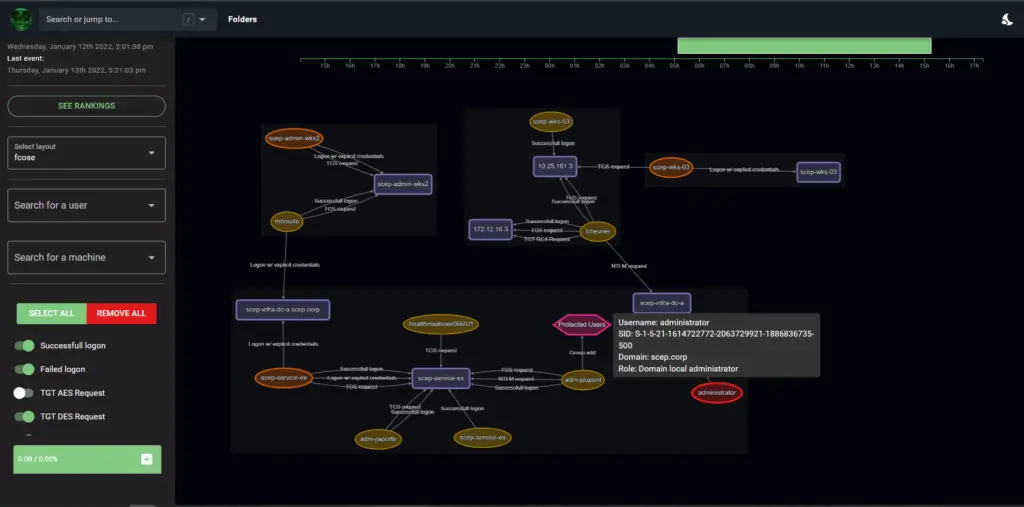
Epagneul is a tool to visualize and investigate windows event logs.
Deployment
Requires docker and docker-compose to be installed.
Installing
make
Offline deployment
On a machine connected to internet, build an offline release:
make release
This will create a release folder containing ready to go docker images. Copy the project to your air gapped machine then run:
make load
make
This will install:
- epagneul web UI (port 8080)
- epagneul backend (port 8000)
- neo4j (port 7474)
todos
- Better SID corelations
- add edge tips
- Label propagation algorithm
- PageRank
- Add missing events IDs (sysmon)
- Proper conversion of known SIDS / security principals, …
- hidden markov chains
- Display a timeline of logons / at least a summary graph
- check out: https://github.com/ahmedkhlief/APT-Hunter
- Import data from ELK / splunk
- detect communities using louvain
- Document evtx filtering method using filter
3,4648,4624,4625,4672,4768,4769,4771,4776,4728,4732,4756
Known bugs
- The
countvalue on edges does not update based on the selected timeline
References:
https://adsecurity.org/wp-content/uploads/2017/04/2017-BSidesCharm-DetectingtheElusive-ActiveDirectoryThreatHunting-Final.pdf
https://github.com/JPCERTCC/LogonTracer
Built With
- Vue.js – The web framework used
- Cytoscape.js – Library used for graph visualisation and analysis
- d3 – Used to display the timeline
- neo4j – Backend database
- evtx – Parser for the windows XML EventLog format
Authors
- jurelou – Initial work – jurelou
